


Mit dem Laden des Videos akzeptieren Sie die Datenschutzerklärung von YouTube.
Mehr erfahren
ImageMaster® HR TempControl – Testing image quality in temperature ranges from -40° C to 120° C
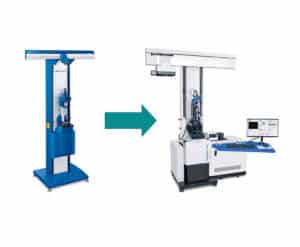
ImageMaster® HR 2 /HR TempControl/Universal
Image quality testing for lenses with highest precision and reliability
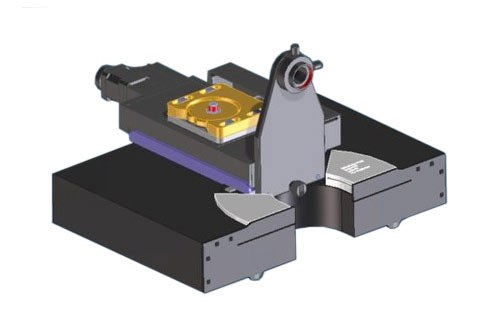
The devices ImageMaster® HR 2 and Universal provide an outstanding level of accuracy and flexibility when testing the MTF (modulation transfer function). The equipment is modular and upgradeable to allow for custom configuration as test requirements change. The instrument can be configured for testing optical systems with the object at infinity or object and image at finite conjugates. The accuracy of the measurement is traceable to international standards.
The ImageMaster® HR 2 offers versatile functionality for testing the image quality of small and medium-sized lenses, e.g. for smartphone, photo and film cameras. With the ImageMaster® HR TempControl test samples, which have to provide their optical functionality and performance at extreme temperatures, can be measured in a wide temperature range.
For medium and larger lenses, e.g. in camera lens manufacturing and the development of aerial lenses or lenses for space exploration, the horizontally mounted ImageMaster® Universal offers the highest accuracy and maximum stability.

Highest accuracy
The products ImageMaster® HR 2 and Universal fulfill highest customer requirements for image quality testing. ImageMaster® HR 2 is the preferred MTF test station for R&D labs worldwide. Measurements with increased accuracy and flexibility are the main focus.

Testing in a wide spectral range
The wide model range of ImageMaster® HR 2 and Universal allows measurement of a large number of optical parameters over a wide spectral range. The ImageMaster® HR can be used to measure lenses in the spectral range NUV-VIS-NIR-SWIR-MWIR-LWIR. The ImageMaster® Universal is flexibly suitable for MTF Testing in the entire spectral range UV-VIS-NIR-SWIR-MWIR-LWIR from 200 to 13,000nm.

Versatile range of applications
The ImageMaster® HR 2 and Universal are available in numerous variants and also enable with different collimator options, e.g. mirror collimators, precise measurement of samples with large focal length ranges. For optical systems that are used under different temperature and weather conditions, measurements in a wide temperature range are possible with the ImageMaster® HR TempControl.
Product Overview ImageMaster® HR
ImageMaster® HR 2
Image quality testing with highest repeatability

The ImageMaster® HR 2 is our completely redesigned new version of the long-time successful ImageMaster® HR – the worldwide standard for image quality testing of small and medium-sized lenses e. g. for smartphone-, photo- and film cameras.
Testing image quality in SWIR for automotive and smartphone applications
Proximity sensors in vehicles are an important feature for driver assistance systems. They operate in the short infrared spectrum (SWIR), so a suitable measurement system is required to test the image quality. Moreover, measurement in SWIR spectrum becomes more important, for smartphone lenses. With a measurement accuracy of ±0.03 MTF and reproducibility of ±0.01 MTF the system meets the highest requirements even for small apertures.

ImageMaster® HR MAX
Testing with mirror collimators

ImageMaster® HR MAX has been developed for high-precision MTF testing in the VIS and IR range.
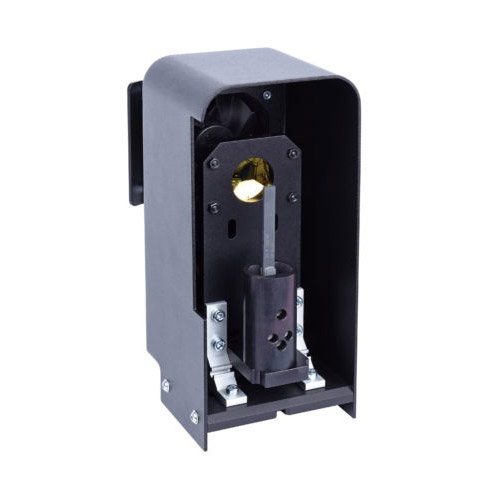
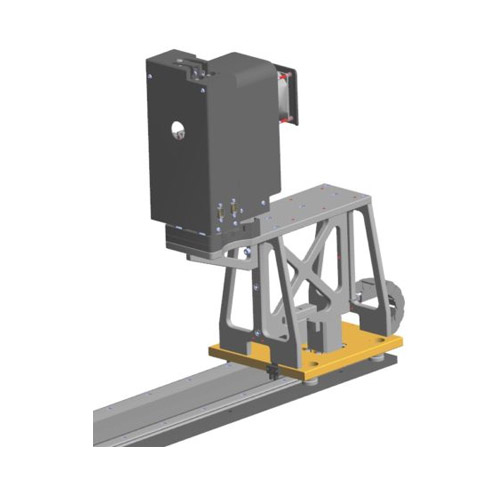
ImageMaster® HR TempControl
Testing Image Quality in Temp. Ranges from -40°C to 120°C

Many optical systems such as lenses and camera modules are used in a wide temperature range and must consistently maintain their full functionality and performance across varying temperatures. Athermal designs should minimize the thermal influences on opto-mechanical parameters.
The ImageMaster® HR will be discontinued on June 30, 2024!
ImageMaster® HR 2 – Enhancing the worldwide standard for image quality testing of lenses and objectives
The ImageMaster® HR has been the MTF test station preferred by R&D laboratories worldwide and has always offered highest accuracy and repeatability. As the successor to the worldwide standard for image quality testing of lenses, the newly developed, ImageMaster® HR 2 is available, e.g. for smartphones, surveillance cameras and camera modules for the automotive industry.
ImageMaster® HR
The preferred MTF test station worldwide

The ImageMaster® HR fulfils the high customer requirements for accuracy and flexibility in the measurement of image quality.
Product Overview ImageMaster® Universal


Applications
ImageMaster® HR 2
The ImageMaster® HR MTF test station measures visual and infrared lenses. The following parameters can be measured:
All MTF measurements can be performed with the ImageMaster® HR in finite and infinite measurement position.
ImageMaster® HR TempControl
In addition to determination of the MTF, the key measurement parameter is the change in both the flange focal length and effective focal length when the temperature changes.
In addition to military and aerospace applications, cameras are also being used in the automotive industry as safety-critical systems whose properties must be tested and ensured across a broad temperature span.
In general, the image quality of lenses can be affected by temperature influences on the optical components and mounting materials. Crucial lens parameters such as effective focal length and flange focal length can be temperature-dependent and have an impact on the camera’s focusing function.
Due to the easy system conversion from VIS to NIR, the specific requirements from various areas, including the automotive industry, development of mobile phone lenses, and the military and aerospace sectors are covered.
Measurement parameters:
ImageMaster® Universal
With the MTF test station ImageMaster® Universal lenses can be measured in all spectral ranges from UV to LWIR.
The following parameters can be measured:
All MTF measurements can be performed with the ImageMaster® Universal in finite, infinite and afocal measurement position.
Software
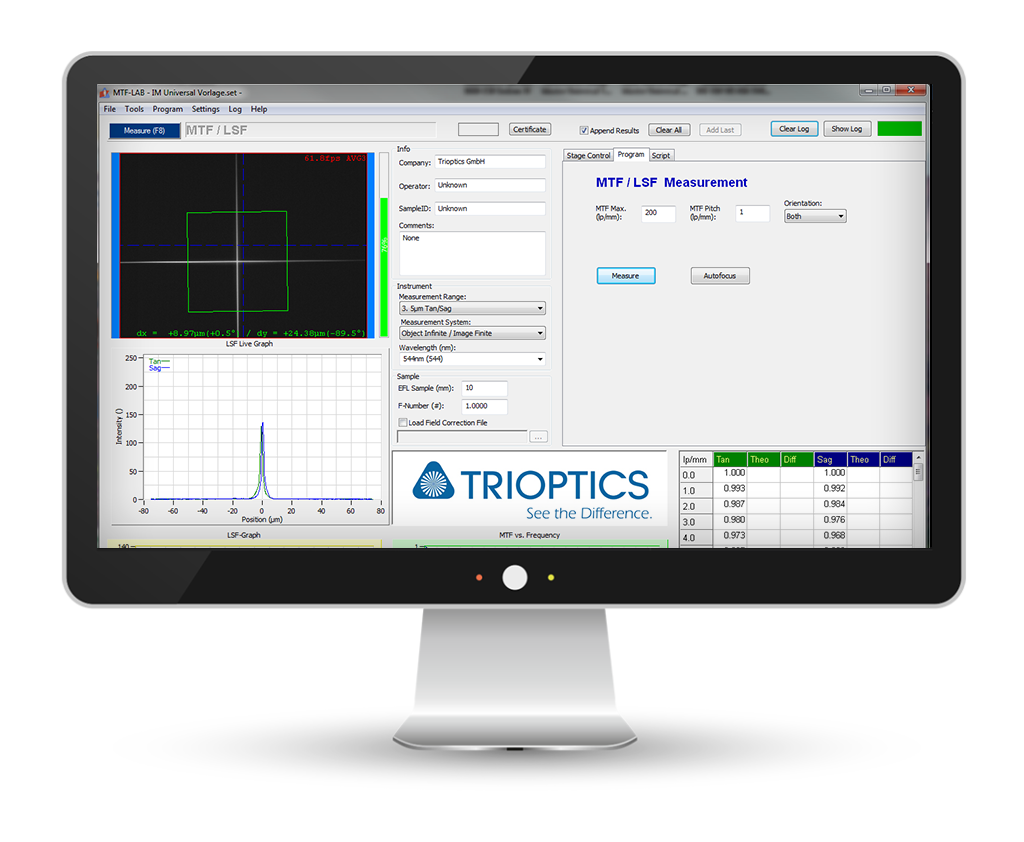
ImageMaster® MTF Lab and MTF Studio Software
User-friendly software for research and development as well as laboratory work.
The versatile functionality and high performance make the user-friendly ImageMaster® MTF Studio software package the preferred choice for R&D and laboratory work. High-performance functions help the user to optimize the measurement processes.
The software offers high flexibility for measurements in the NUV-, VIS- and NIR spectrum. Automatic measurement sequences ensure easy operation and the data can be output in CSV/MHT.
Several useful functions are integrated which help the user to scan and perceive the correct image position of the sample under test. Changing the measurement mode is easy and time-saving. All important measurements for the imaging properties are quickly accessible.
One main feature key feature when using the software with the ImageMaster® Universal is the support of UV or IR detectors employing the scanning aperture method.
- Easy to handle graphical user interface makes the most important functions only one mouse-click away
- Customizable arrangement of graph windows
- Measurements of MTF, EFL and a range of other parameters using special target patterns and dedicated software routines
- Functions for easy alignment of the sample under test
- Conventional MTF measurement using a single slit or a crosshair as a target
- Optionally automated selection and positioning of the suitable reticle (target) and filter for the current application
- Configuration files with optimized process parameters and password protected access for operator and supervisor
- Script tools for custom programming and analysis
- Intuitive user interface and time-saving lens test routines
- Logging of successive measurements
- Data export to a variety of file formats
- The certificate in HTML format can be imported into MS Excel
For measurements in the temperature range from -40°C to 120°C, the proven MTF Lab software has been extended.
Powerful functions assist the user in performing the necessary measurement processes to determine a variety of parameters to determine the optical performance in the extended temperature range.
- Measurements of MTF, EFL and a range of other parameters using special target patterns and dedicated software routines
- Functions for easy alignment of the sample under test
- Conventional MTF measurement using a single slit or a crosshair as a target
- Optionally automated selection and positioning of the suitable reticle (target) and filter for the current application
- Configuration files with optimized process parameters and password protected access for operator and supervisor
- Script tools for custom programming and analysis
- Intuitive user interface and time-saving lens test routines
- The certificate in HTML format can be imported into MS Excel
Technical Data
| Parameter | ImageMaster®HR 2 | ImageMaster® HR VIS | ImageMaster® HR IR | ImageMaster® HR MAX |
|---|---|---|---|---|
| Optical set up | Infinite conjugates (finite optional) | Infinite conjugates (finite optional) | Infinite conjugates | Infinite conjugates (finite optional) |
| Max. off-axis angle | Up to ±105° | Up to ±110° | Up to ±110° | Up to ±70° |
| Spectral range | NUV, VIS, NIR, SWIR, LWIR | 450 nm … 750 nm, halogen (NIR/NUV optional) | LWIR: 8 µm … 12 µm | VIS /NIR NUV optional |
| Azimuth range | 360° | 360° | 360° | 360° |
| Max. image height | ±40 mm | ±23 mm | ±23 mm | ±23 mm |
| Clear aperture | up to 45 mm | up to 100 mm | ||
| Collimator range | 50 mm, 300 mm, 500 mm | 50 mm … 500 mm | 50 mm2) | 50 mm … 1,000 mm |
| EFL range of the sample | 0.5 mm - 150 mm | 1 mm … 150 mm 1) | 1 mm ... 10 mm1),2) | 1 mm … 200 mm 1) |
| Spatial frequency (in specification) Max. spatial frequency | 0 lp/mm - 500 lp/mm | 0 lp/mm … 500 lp/mm 1,000 lp/mm (depending on sample) | 0 lp/mm … 60 lp/mm | 0 lp/mm … 500 lp/mm 1,000 lp/mm (depending on sample) |
| Accuracy (MTF on-axis and off-axis) | ±0.02 MTF | ±0.02 MTF | ±0.03 MTF | ±0.02 MTF |
| Repeatability (MTF on-axis and off-axis) | ±0.005 MTF | ±0.005 MTF | ±0.02 MTF | ±0.005 MTF |
1) Depends on mirror collimator
2) Larger on request
Upgrades & Accessories
ImageMaster® HR 2
The ImageMaster® HR 2 is adapted to customer-specific measurement requirements by means of versatile upgrades.
- Motorized ultraprecise sample holder with a radial runout better than 3 μm / 6 arcsec for more accurate measurements of tilt sensitive samples
- Additional filters and reticles for all measurement applications: Filters for NUV, VIS, NIR / reticles extendable, e.g. for PSF and veiling glare measurements
- Extensions of nearly all stages to suit the customer’s needs
• Motorized finite conjugate stage with manual or motorized object generator. The motorized object generator illuminates the reticle in the direction of the sample
for off-axis measurements. This is needed for small samples or low light conditions
• Various collimators with focal length and clear aperture for high flexibility
• Motorized reticle and filter changer for infinite conjugate to measure with least interaction of an operator. The lateral chromatic aberration can be measured more accurately as the filter will be changed automatically with no vibration of a manual change
• With the veiling glare upgrade for ImageMaster® HR it is possible to measure the Glare Spread Function (GSF). By off-axis measurements and rotation of the specimen around its center, the GSF can be measured over the entire field of view of the sample.

Upgrade ImageMaster® HR 2 to CamTest R&D
TRIOPTICS provides customers maximum versatility offering a combined test system. The three exchangeable measurement heads offer the following possibilities:
ImageMaster® HR 2
Image quality measurement of lenses with following parameter:
- MTF on-axis and off-axis
- Effective Focal Length (EFL)
- Distortion
- Field curvature
- Lateral and longitudinal chromatic aberrations
- Astigmatism
- Chief Ray Angle
- PSF (Point Spread Function)
- Veiling Glare
- Depth of focus
- Field of view
- Flange Focal Length (FFL) relative
- Relative illumination
CamTest R&D
Image quality measurement of camera modules with following parameter:
- Line Spread Function (LSF)
- MTF
- Distortion
- Effective Focal Length (EFL)
- Shift, tilt and defocus of the sensor
- Image field curvature of the lens
- Lateral and longitudinal chromatic aberrations
ImageMaster® HR TempControl
A number of upgrades are available to extend the functionality of the ImageMaster® HR TempControl:
- Upgrade for measurements in the near infrared range
- Upgrade for LWIR- and MWIR-measurement
- Upgrade for distortion measurement
- Upgrade for ultra-precise FFL measurements
- Upgrade for measurements in the extended temperature range from -40°C to +120°C
ImageMaster® Universal
Enhance the functionality of your ImageMaster® Universal system with comprehensive upgrades and accessories.
Light sources for different wavelengths are available for the ImageMaster® Universal:
- UV
- VIS / NIR / SWIR
- MWIR/LWIR
MWIR/LWIR Light Source for ImageMaster® Universal
Various camera based or scanning based detectors are available as image analyser for different wavelength ranges:
- UV (scanning based)
- VIS (camera/scanning based)
- NIR (camera/scanning based)
- SWIR (scanning based)
- MWIR (kamera-/scannerbasiert)
- LWIR (kamera-/scannerbasiert)

Camera VIS for ImageMaster® Universal

Detector MWIR for ImageMaster® Universal
Sample Holders for various diameters and a lifting table for large samples are available for the Image Master® Universal.

Sample Holder for ImageMaster® Universal

Lifting table for ImageMaster® Universal
For finite conjugate measurements a finite stage is available as upgrade in two different stage lengths for all wavelength ranges:
- Finite Stage 2m
- Finite Stage 3m
Finite Stage for ImageMaster® Universal
- Reticle and filter changer
- Reticles
- Filter

Reticle and Filter Changer

Reticles

Filters
The automated ultra-precision afocal unit is available as upgrade for afocal samples. With different autocollimator lenses for the afocal unit measurement in different wavelength ranges can be executed.
Afocal unit with
- Decollimator lens for VIS
- Decollimator lens for MWIR
- Decollimator lens for LWIR
Afocal unit
Knowledge Base
MTF and image quality
MTF Testing / Measurement / Inspection – Modulation Transfer Function
The Modulation Transfer Function (MTF) is an important aid to objective evaluation of the image-forming capability of optical systems. Not only that the MTF provides a means of expressing the imaging quality of optical systems objectively and quantitatively, but it can be calculated from the lens design data. In this way it allows optical and systems designers to predict reliably the performance of the optical systems. The manufacturers can compare the image quality of the manufactured lenses with the design expectations.
The MTF measurement is an important tool for the objective assessment of the imaging performance of optical systems. Moreover, the MTF can be calculated from the lens design data giving designers of optical systems the ability to predict system performance reliably. The manufacturer can then compare the image quality of real lenses with the expectations from the design phase.
MTF-Modulation Transfer Function
The Modulation Transfer Function (MTF), describing the resolution and performance of an optical system, is the ratio of relative image contrast divided by relative object contrast MTF = Relative Image Contrast/Relative Object Contrast. When an object (illuminated target or reticle) is observed with an optical system, the resulting image will be somewhat degraded due to inevitable aberrations and diffraction phenomena. In addition, a real lens will not fully conform to the design data.
More knowledge for experts
This article inspired you? Are you looking for further knowledge transfer?
Then you might also be interested in the following topics…
(with Shack-Hartmann-Sensoren)
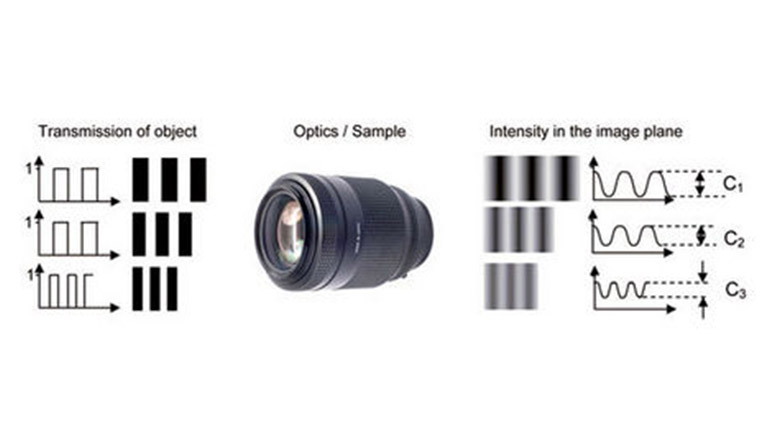
Perfect grid pattern is imaged through the sample into the image plane
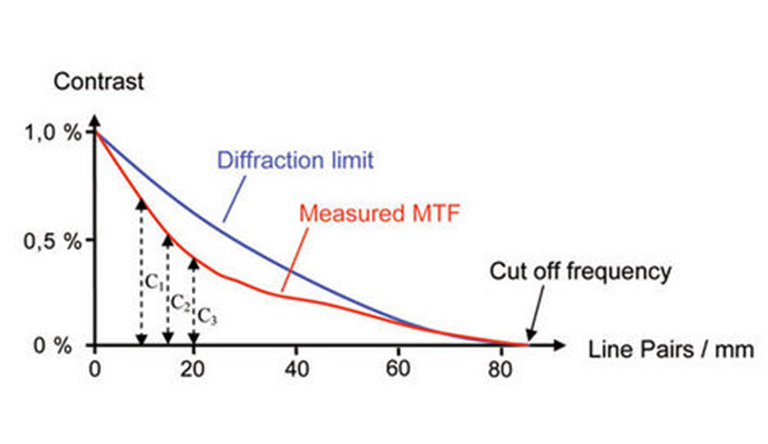
Contrast vs spatial frequency. This figure shows the MTF of the diffraction limited optics and a measured MTF referring to Fig. 1
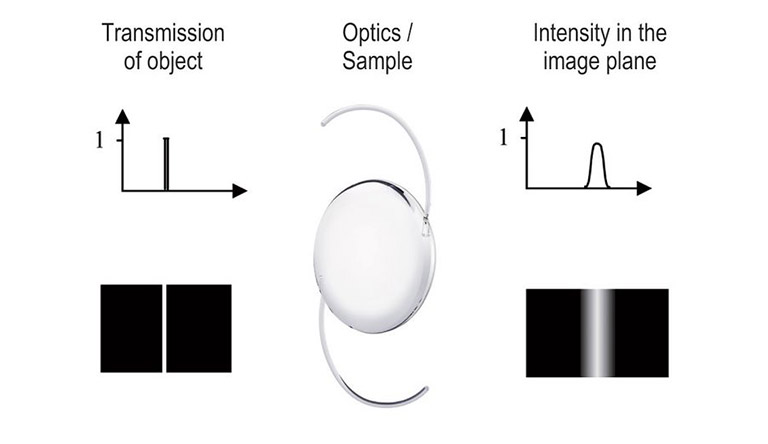
The image of a perfect slit is called “Line Spread Function”
Manufacturing errors, assembly and alignment errors in the optics will deteriorate the overall imaging performance of the system. As a result, in the image, bright highlights will not appear as bright as they do in the object, and dark or shadowed areas will not be as black as those observed in the original patterns. In general an illuminated target can be defined by its spatial frequency (number of bright and dark areas per millimeter) and the contrast (the apparent difference in brightness between bright and dark areas of the image).
By convention, the modulation transfer function is normalized to unity at zero spatial frequency. For low spatial frequencies, the modulation transfer function is close to 1 (or 100%) and generally falls as the spatial frequency increases until it reaches zero. The contrast values are lower for higher spatial frequencies as shown above. As spatial frequency increases, the MTF curve falls until it reaches zero. This is limit of resolution for a given optical system or the so called cut off frequency (see figure below). When the contrast value reaches zero, the image becomes a uniform shade of grey.
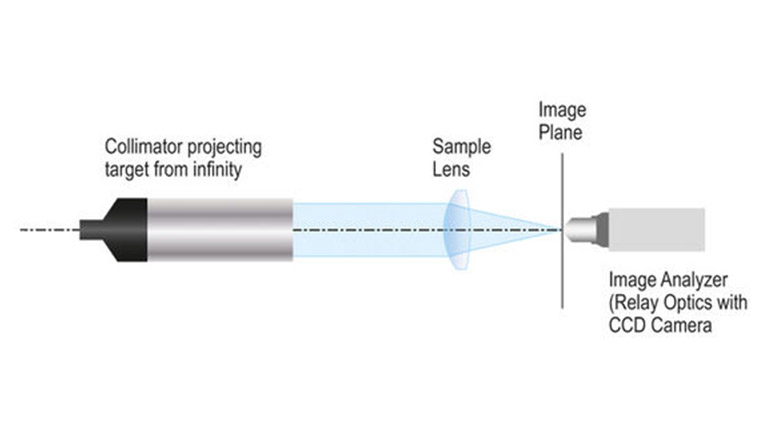
Typical setup for on-axis MTF measurements
The grids shown are actually no longer used in order to measure the MTF. Modern MTF-Testers like the ImageMaster® use a single illuminated slit on opaque background as the object. From a mathematical point of view a single slit can be regarded as the sum over all spatial frequencies (Fourier synthesis). All frequencies contribute with the same amplitude (=1) to this slit not taking the finite slit width into account for this description. This single slit will be imaged into the image plane of the sample. Due to diffraction and aberrations there will be no perfect slit image in this plane, instead the slit image is broadened. It represents the so called Line Spread Function (LSF). On the basis of Fourier analysis the contribution of each spatial frequency to the LSF can be calculated. Actually the amplitude of each spatial frequency is equal to the contrast at this frequency. The Fourier analysis of the Lines Spread Function corresponds to the MTF of the sample. Taking a single image of the LSF unveils the complete MTF. Alternatively it is also possible to use a cross (i.e. two perpendicular slits) for the target. This enables the ImageMaster® to measure the MTF in two image directions simultaneously provided a CCD camera is used for the image analyzer. And finally a pinhole target can be used as the object, too. The image of a pinhole target is called Point Spread Function. This function contains the complete MTF information in all image directions. The basic terms and mathematical relations used for MTF are described in the ISO 9334 standard.
The modulation transfer function varies not only related to the spatial frequency but also with the position in the field of view. The MTF measurement along the axis of symmetry of the optical system is known as on-axis measurement.
To completely characterize the imaging performance of an optical system, the MTF must be measured at different positions within the field of view. The MTF measurement within the field of view is known as off-axis measurement. In order to achieve an off-axis measurement, the target is moved in the field of view at the desired object position and the image analyzer to the corresponding image position.
The MTF measurement can be accomplished at a single wavelength or in a spectral range covering a finite band of wavelengths. The resulting measurement data are known as monochromatic or polychromatic MTF values, respectively.
Usually the MTF is used in its one-dimensional form, calculated for one azimuthal section through the image plane. The azimuth (section plane) of the object pattern is called sagittal azimuth when the prolongation of the slit or object passes through the reference axis. When the prolongation of the slit pattern is perpendicular to the reference axis, the azimuth is called tangential azimuth.
In this so-called finite-finite imaging condition the illuminated slit or crosshair target is directly moved in the object plane of the sample. In the more common infinite-finite imaging condition, the illuminated slit or crosshair is part of a collimator projecting the target to infinity. The collimator is then oriented at different off axis angles for characterizing the MTF at the corresponding image fields. Figure 4 shows the typical setup for this imaging condition.
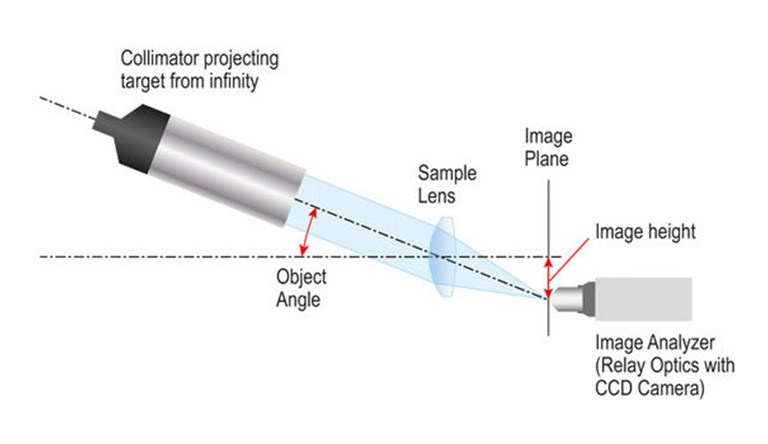
Typical setup for off-axis MTF measurements
EFL
The Effective Focal Length (EFL) or equivalent focal length is the distance from the focal points of the lens to the respective principal planes. The EFL determines the magnification of a lens and hence the image size. Because the principal planes are usually inside the lens at unknown locations, the direct measurement of the EFL is difficult.
However, the EFL can be measured quickly and with sufficient accuracy using the method of measuring the magnification of a double bar target. Certified master lenses from PTB (National German Standard Institute) are available at TRIOPTICS and are used for the calibration of the measurement setup. The measurement data are thus directly traceable to international standards.
EFL and Distortion
Distortion is the percentage of change in magnification between the center of the field of view and off-axis positions in the field of view. In order to determine the distortion a different method of measuring the EFL is used:
- A MTF measurement on axis (at a selected frequency) is carried out. The paraxial focal plane is determined using the MTF measurement at a frequency of interest. To achieve a high accuracy monochromatic light and MTF curve fitting are used while the aperture of the lens is reduced by a diaphragm.
- An angular field range and a number of measurement points are selected. The object generator will automatically move to the selected field positions.
- At each position in field the image height is measured. A table with value pairs image height vs. field angles is provided.
- The EFL is calculated with the formula
- h/(tan α ) and drawn into a curve vs field angle. A polynomial fitting of the EFL close to α =0 allows the accurate and independent calculation of the paraxial focal length.
- The distortion is calculated as the ratio between paraxial and field focal length following the ISO 9039:2008.
This procedure requires a comparatively large number of measurement points with accurately known object angles and field positions. For this reason ImageMaster® instruments with dedicated distortion measurement option feature a high precision angular encoder for the object generator (accuracy 5 arcsec) and a high precision linear encoder for the image field stage (accuracy 0.2 μm). This way, the EFL is calculated as an absolute quantity, not depending on calibration parameters.
Depth of focus
The depth of focus is the extent of the region in front of and behind the image plane in which the image will appear to be sharp.
The depth of focus can be determined using a “through focus scan” of the MTF and setting appropriate tolerances for the drop in MTF. The depth of focus between the set tolerances will be measured and displayed.
A more complex measurement can be done simulating the range of object distances covered by the lens and measuring the MTF at the corresponding image distances.
Field Curvature
Field curvature is an optical aberration in which the focus position changes from the center to the edge of the field of view. The curvature of the image field is a lens aberration that causes a flat object surface to be imaged onto a curved surface rather than a plane.
In the presence of the astigmatism, there are two separate astigmatic focal surfaces in orthogonal directions.
To determine the field curvature a set of through focus measurements at different positions in the field are taken. The MTF maxima and the corresponding positions in field are determined. The values are collected by a software routine and displayed in graphical and tabular form.
Relative Illumination
Relative illumination in an optical system is the gradual reduction of the image brightness with increased off-axis angle. This phenomenon results from the fall of, which is approximated by the cos4 or “cosine four law of the illumination falloff. Additionally there is the effect of the apparent limitation of the clear aperture depending on the field angle. Relative illumination is defined as the ratio of the central transmission and the transmission at the edge of the field of view.
The ImageMaster®-Software measures continuously the light intensity of the test pattern in order to avoid saturation. In this way the necessary data is available for determining the relative illumination following ISO 13653:1996.
Chief Ray Angle (CRA)
A chief ray is the ray from an off-axis object point which passes through the center of the aperture stop of an optical system. The chief ray enters the optical system along a line directed towards the midpoint of the entrance pupil, and leaves the system along a line passing through the center of the exit pupil. To measure the angle between the optical axis and the chief ray on the image side the following method is used: The lens under test is illuminated by the collimator at different angles corresponding to the object sided chief ray angles. The detector head is moved to the image field position at which the lens focuses the image. Now the detector head is moved towards the lens in small steps while the software registers the lateral movement of the focused spot. From these lateral movements the CRA is calculated.
Measurement procedure of chief ray angle
F-number
The F-Number of a lens is defined by the ratio between the EFL and the diameter of the entrance pupil. The ImageMaster® series instruments use the ISO-517 method to accomplish the measurement: First the EFL is measured according to the procedure described before. Then the sample is turned around with the entrance pupil facing towards the detector head. The diameter of the entrance pupil is measured by first focusing on the left, then on the right edge of the pupil. The travelling distance of the image field stage represents the diameter of the entrance pupil. By choosing the proper head lens of the detector head even pupils positioned far inside of the system under test can be measured.
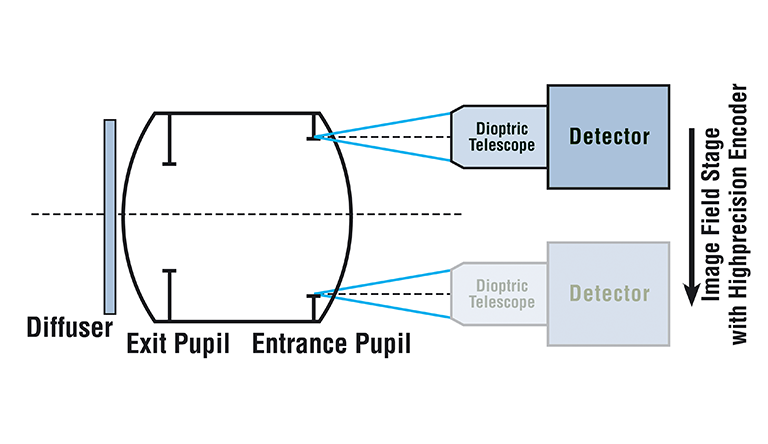
Measurement procedure of F-number
Chromatic Aberrations
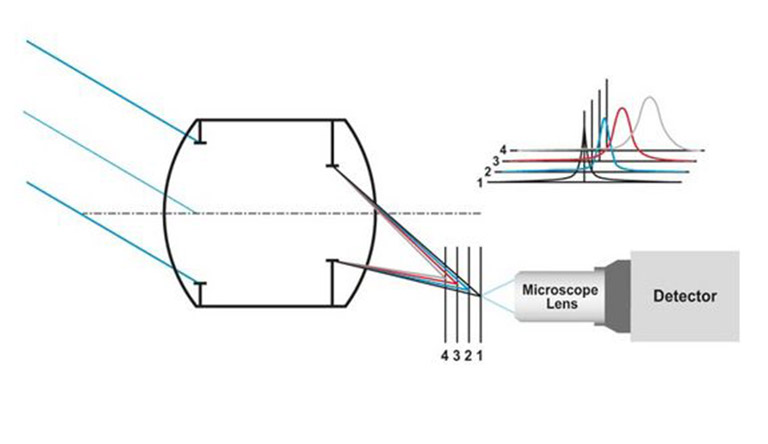
Due to the dispersion of refractive optical systems the image position and also magnification of an optical system depends on the wavelength of the light. The dependence of the axial image position on the wavelength is called Chromatic Focal Shift. The dependence of the magnification on the wavelength is called Lateral Chromatic Aberration. Both aberrations can be measured with the ImageMaster®. The collimator of the ImageMaster® is equipped with different narrow bandwidth color filters. Together with the highly corrected relay optics this enables the system to focus in axial direction to the different image positions for different colors. The image position measurement can be done with submicron accuracy. Measuring the lateral image position for different object angles enables the system to measure the lateral chromatic aberration.

Principle of the measurement of the axial chromatic aberrations
